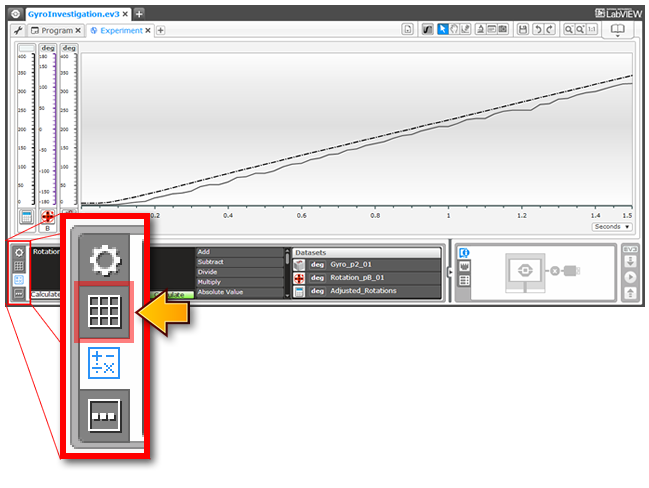
- :-

Topics Covered

  • Reading values
  • Point Analysis Tool
  • Lesson Links

    Check Your Understanding:
    1. 1. To find out what time the Gyro Sensor value reaches 200 degrees, you...
    2. Find the place on the graph where the Rotation Sensor and Gyro Sensor lines cross, then see what the X-axis value is at that point
      Find the place on the graph where the Gyro Sensor line crosses Y=200, then see what the X-axis value is at that point
      Find the place on the graph where the Gyro Sensor line crosses X=200, then see what the Y-axis value is at that point
      Move the cursor around the graph until it turns green, then see what the X-axis value is at that point
    3. 2. To find out what each sensor reading is at 0.5 seconds into the turn, you...
    4. Use the mouse cursor to find the place where the sensor's line crosses X=0.5, then see what the Y-axis value is at that point
      Use the Point Analysis Tool to put a vertical line at X=0.5, and read each Dataset's value at that point
      Both of the above methods work
      None of the listed methods work
    Try It!
    Try it! 1

    Dataset Table

    You can also see the exact values for each sensor in numeric format in the Dataset Tables View.
    Can you find 200 degrees for each sensor in the table? Try it!


    1. Click the second tab in the lower-left to view the Datasets as tables
    2. Scroll to the right until you find the values you are looking for
    3. Look at the "Start Time" above each reading to see what time it occurs
    4. Do the numbers match what you got using the method in the video? Try it!
    What happens?
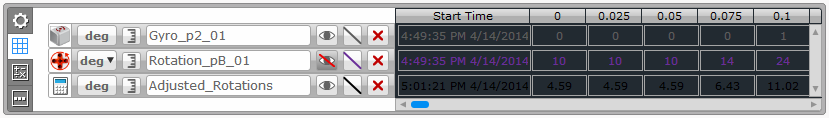
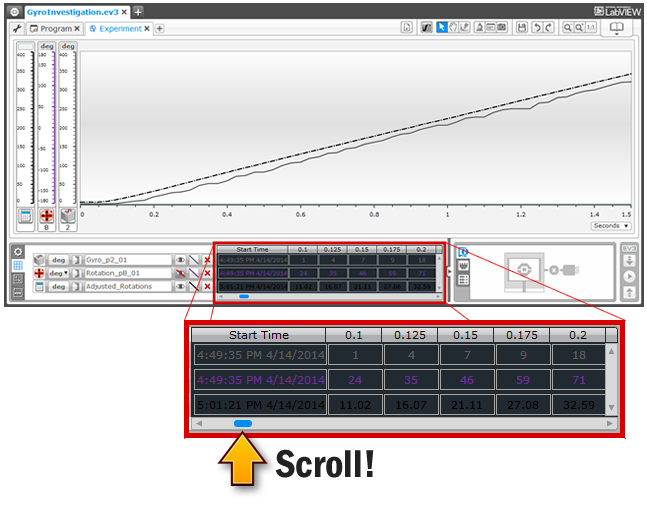
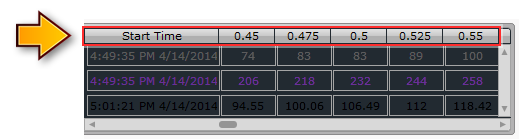
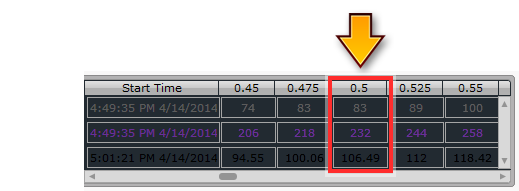
    The values in the Dataset table are the same as the points on the graph. The results should match perfectly!